
Bitcoin Bears Take Control: Why $76K Is the Make-or-Break Level (April 2026)
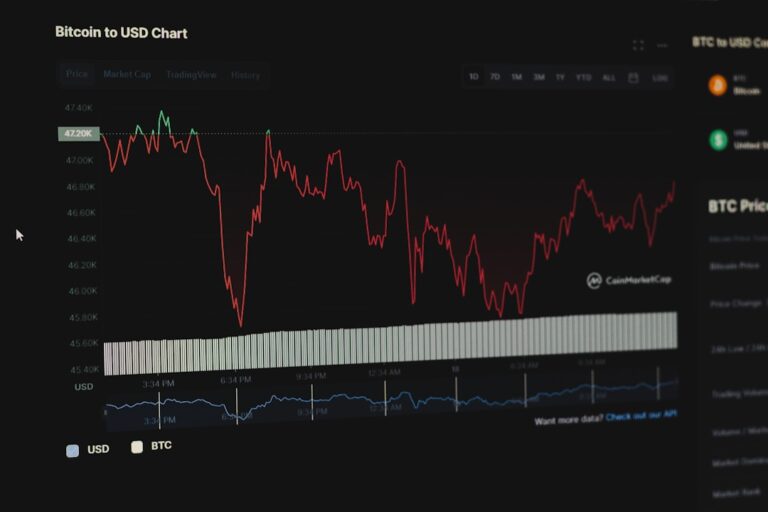
Bitcoin is trapped in a tightening range, and technical analysts are warning that the path of least resistance may be down. After weeks of consolidating between $60,000 and $73,000, the world’s largest cryptocurrency is facing a critical technical setup — with $76,000 representing the level bulls must clear to avoid new lows.
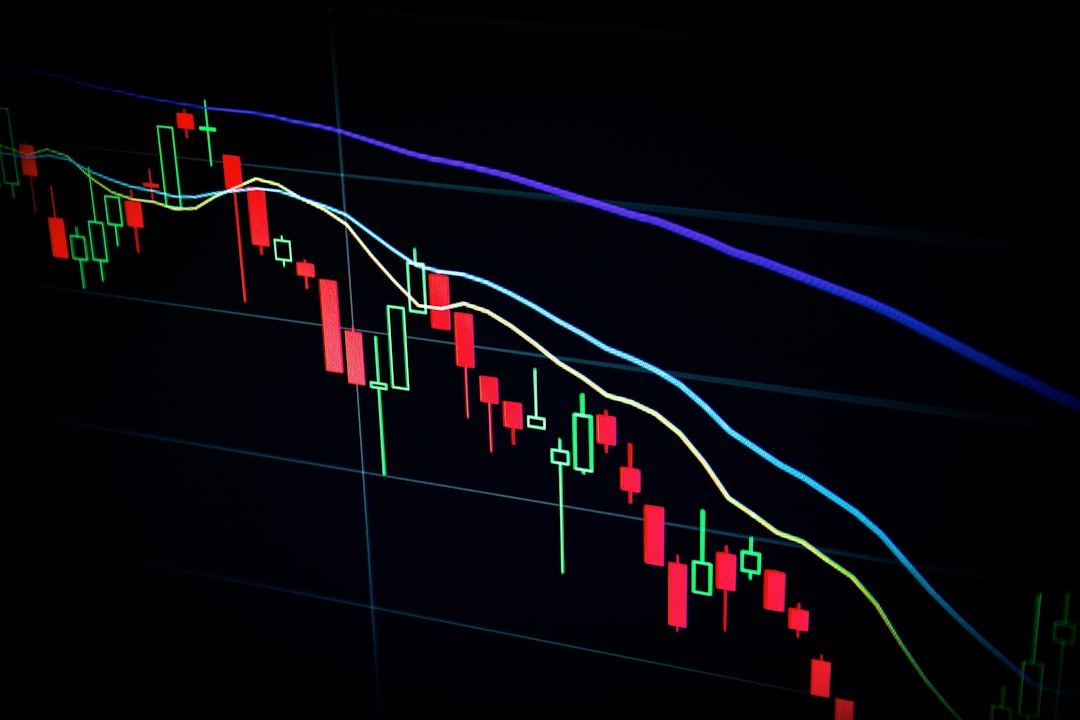
The Bear Flag in Play
Bitcoin’s daily chart shows a bear flag continuation pattern. This pattern first confirmed on January 20, when BTC price entered a correction to $60,014. Now, a second bear flag is in play — and every price rally to the flag’s overhead trendline has been rebuffed since February 8.
Technical analysis stresses the importance of a rally and multi-day candle close above $76,000 to negate the pattern. Ideally, that rally would hold through a 2- to 3-day consecutive candle close, followed by a retest of the trendline at $75,000 to confirm a support-resistance flip.
Chartered market technician Aksel Kibar predicts a potential price drop to $52,500 if the lower boundary of the pattern breaks. That would represent roughly a 25% decline from current levels.
Why $60,000 Still Holds (For Now)
Despite intensifying headwinds — Brent crude oil at 2008 highs, hot war between the US/Israel/Iran, S&P 500 down 3.95% year-to-date — Bitcoin buyers have shown steady appetite for buying the price dips to $60,000. The level currently holds as support, but the risk of lower prices is not zero.
Here’s the key: until $76,000 becomes support, new lows remain on the table. The market appears to be searching for a catalyst — either capital flow or narrative — that would push traders into larger directional bets.
The Liquidation Risk Map
Data from Hyblock shows a large number of leveraged long positions at risk of liquidation if BTC falls into the $63,000 to $65,000 range. Below that is a liquidity gap, with the next block of open margin long positions starting in the $57,500 to $56,000 range.
Bitcoin’s aggregated open interest remains pinned below $20 billion — a level not seen since February 2, when BTC traded near $79,000. That indicates relatively flat market demand across spot and futures markets.
What to Watch
- $76,000 resistance — Must clear and hold for bull case to remain alive
- $60,000 support — Current floor; breakdown opens path to $52,500
- Bear flag lower boundary — Break below confirms pattern, targets lower lows
- Oil/geopolitics — Any de-escalation could provide tailwind
Until such a catalyst emerges, Bitcoin will likely continue trading within its $10,000 range — with $60,000 as the lowest key support and $70,000 as the most challenging level of resistance.
Technical patterns are not guarantees. But the setup is clear: Bitcoin needs to reclaim $76,000 — or risk a trip back toward $52,500.
Sources
Sources: CoinTelegraph | Aksel Kibar (X) | CoinTelegraph (Oil)